Coach Consultant Robin Williams looks at how you measure technique and how you can be sure it is working
We can constantly measure physical training because it is all about numbers isn’t it?
Boat speeds, stroke rates, splits, ergo scores, weights lifted, hours done and so on. We know what the numbers mean and if they are going in the right direction then we know with certainty that we are making progress, and that gives a sense of reward. But technique is much more subjective. You think you are rowing better but are you really? Where’s the evidence?
Often it just boils down to the coach or teammates saying it looks better or it feels better. So training is factual, technique more about opinion. Or is it? There are ways of checking and as we head into the autumn and winter months it is a good time to get to grips with it and put measuring systems in place.
Millimetres per stroke
What we need is foresight. At the top level the best crews know how to win, sometimes not by very much, but their margins have a certain confidence about them.
Consider Jürgen Grobler’s coaching wins at the last five Olympic Games with the men’s four. From Sydney to Rio, the margins were 0.38 seconds, 0.08 seconds, 1.28 seconds, 1.22 seconds, and a ‘comfortable’ 1.83 seconds.
It is easy to analyse the quality after watching our heroes achieve their dream, but hindsight is easy. Dial back the clock to the previous autumn and each of the A-final crews is quietly going about their training at home, believing it will be them in nine months’ time. They have half a million strokes ahead of them, so who will do the best job?
What to measure?
Before we look at how to measure and monitor technique, we need to know what we are measuring. We can easily measure outcomes of good technique like boat speed, distance per stroke, boat run, and biomechanical indicators like the relationship between posture and length, power versus arc, and so on. The well-funded professional rowing programmes can dedicate resources to all these things, which we’ll look at – but it doesn’t have to cost the earth or take all your time.
Movement is also a useful thing to measure because we can look at one athlete, one stroke and figure what he or she is doing – or trying to do. It is a process which implies an intent: if I use my legs it is because I think pushing will do something for the boat. If I pull my arms it is because it feels like it will contribute to my stroke.
It may, or may not, turn out as I intend because it depends whether I have got the movement right of course, so spotting productive movements and unproductive ones is fundamental in evaluating technique and is quite easy to do. We can all see a crew washing out at the finish. But we also need to quantify it and track any improvements, which we will come to later on.
Training evidence
Let’s start with outcome evidence.
Measuring training speeds is the simplest and obvious way to see if the rowing is becoming more effective and efficient – it is a matter of following trends over time. If you measure all your UT sessions at, say, rate 18 you would hope that the trend would be to get faster for the same effort, or maintain speed for less effort.
You have to do it over a few weeks, of course, because there are ups and downs with rowing on a day-to-day basis, like wind, weather, and water flow which can affect the recorded times.
It is also true that the improving trends could have nothing to do with improving technique – you might just be fitter.
Nevertheless, in most national teams these days they use speed tables to guide training and derive the target training speeds from a prognostic gold-medal time. So, once you know what 100% looks like you might decide that the target speed at rate 18 is 78% of the target, or that at rate 30 it is 94%.
| W8+ | Target time/speed |
| Rate (str/min) | Time per 500 (min:seconds) |
| 14 | 2:01.0 |
| 16 | 1:56.4 |
| 18 | 1:51.6 |
| 20 | 1:47.4 |
| 22 | 1:43.7 |
| 24 | 1:40.4 |
| 26 | 1:37.6 |
| 28 | 1:35.0 |
| 30 | 1:32.8 |
| 32 | 1:30.8 |
| 34 | 1:29.0 |
| 36 | 1:27.5 |
| 38 | 1:26.2 |
| 40 | 1:25.0 |
| 42 | 1:24.0 |
| 44 | 1:23.1 |
| 46 | 1:22.4 |
| 48 | 1:21.9 |
It is pretty hard to achieve these times with poor technique and, in fact, with the higher rates it becomes impossible to achieve them unless you are very technical as well as fit. The leading clubs have versions of this for key domestic competitions like National Schools, BUCS and Henley Royal.
Even so this outcome method only implies that the crew have improved technically and certainly in no way analyses technique.
Telemetry
In-boat telemetry is used by many schools, universities and clubs these days, not just the national teams. There is a cost attached, but many just pay an outside biomechanist to visit three to four times a year in order to keep track of the relevant metrics.
The data from this is very handy as you can check boat set-up, stroke length and angles, blade depths, power output and how well force is produced against the stroke arc, plus boat acceleration traces and so on. Devices like the Oarsport’s Empower Oarlocks are a good investment too and can be useful to see how technique changes with fatigue – eg shortening of stroke length.
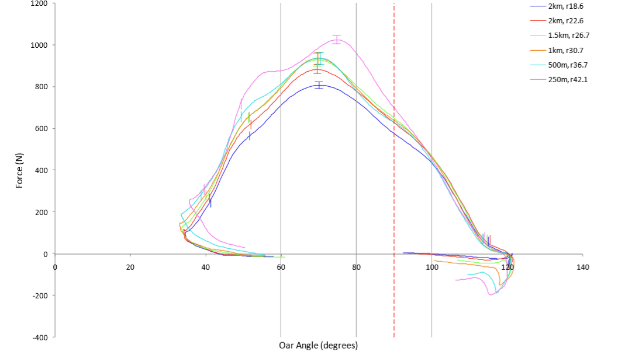
‘Biomech’ on the boat tells you a lot about the work going on in the boat, the number-crunching data, the measurable stuff. It does not describe so well the nuances of feel – how well we let the boat run, the fluidity of recovery sequences, relaxation of the muscles, synchronicity, posture, body language, breathing and cohesion. Some of that information is in there, but it’s hard to pinpoint and there does not seem to be such a thing as a perfect power curve.
We still need something more.
Video
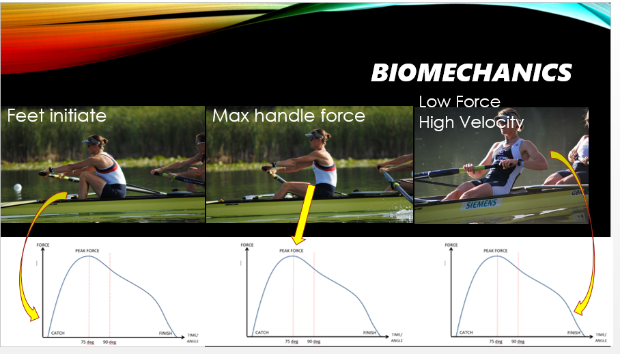
So, that brings us to video which I do find is a good way to measure technique. It is also available to everyone and can be objective and analytical when done frame by frame, but also subjective and qualitative when seen in real time or slow motion, so giving a sense of fluidity, body language and so on.
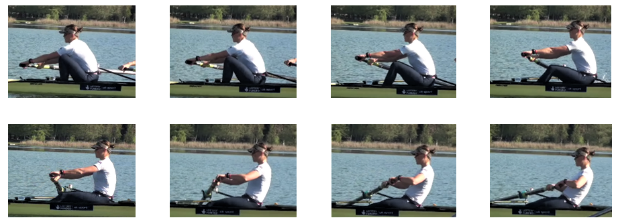
A very easy tool for athletes is to give them a print-out of their sequences of movement as in the examples below. It allows easy comparison of sequences and positional improvements a few weeks apart.
Modern apps like Coach’s Eye are great for quick analysis: a couple of useful references I use are the stern of the boat (especially for small boats) and the rower’s seat.
Logically, when you see the last frame of seat movement stern-ward, it is ready to begin the drive in the other direction. A good beginning would have four parts in position simultaneously: stretcher, seat, handle, and spoon all connected at the same time, like on the first stroke of a start. Unfortunately, it is very usual for the upper body to be out of time with the lower during continuous rowing, so often we see the seat movement begin while the spoon is still covering.
Analysis shows that from the arrival of the seat to the full cover of the spoon is often four to five frames, even with good coordination. The physical size of a spoon means it must take some time to cover.
A smaller sculling spoon will often take three to four frames. Since one frame on a conventional video camera is 0.04 seconds those frames equate to 0.16-0.2 seconds. So, the more coordinated the rower is, the fewer frames are wasted or unproductive, but the major difference between good crews and lesser ones is the catch or engagement.
If the four points (seat, stretcher, handle, spoon) are well connected then it can be done in one frame or 0.04 seconds or even less. The catch happens when the blade is already under the water and is more about quick reaction than power. Some rowers take a leisurely five to eight frames to connect – this would look like a slipped catch, soft trunk, bum-shove, poor kinetic chain between feet and hands etc. Bear in mind that the whole drive phase will only contain 16-18 frames or so when rowing fast.
Adding a time stamp is helpful. In the example here, the clock is zeroed at the arrival of the seat and the spoons are still in the air. In the next frame it has taken 0.16 seconds (four frames) to cover the spoon but there have been some centimetres of seat slippage in that time, as illustrated by the two coloured vertical lines superimposed.
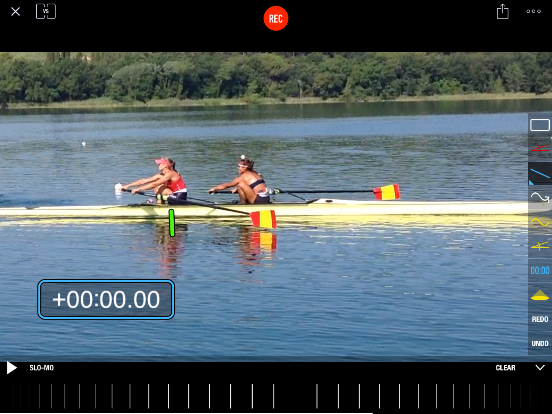
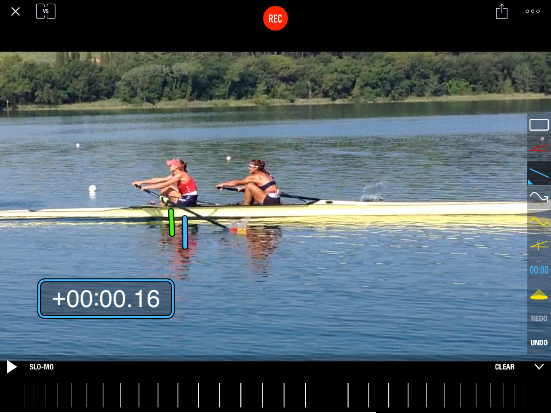
The potential solutions are to give the seat more time near front stops or advance the entry timing of the spoon. Deciding which one is appropriate is a coaching decision.
The whole stroke cycle can be analysed like this, checking positions, sequences, trim of the hull and a simple screen shot is enough to create a record of it.
A powerful learning tool is to show the rower the video during the session, either in slow motion or repeatedly toggling back and forth to pinpoint the specific area of the stroke.
The important conclusion is that technique can be measured, and a rower can be set targets and deadlines much like with the physical training.
Main photo: Drew Smith Other images: Robin Williams