This article is the fourth in a series by British Rowing Performance Satellite Coach Ben Reed on Monitoring and Assessment for Club Coaches. It’s based on a presentation he gave at the 2025 British Rowing Coaching Conference along with former British Rowing Satellite Coach (Yorkshire) Matt Paul.
To recap on the first article in the series, monitoring can be split into four different areas, following the model of the training process itself:
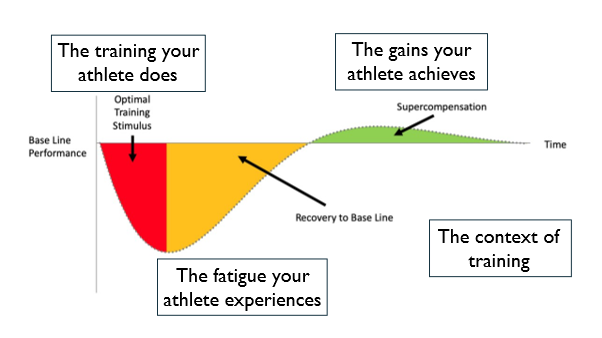
- The context of the training
- The training your athlete does
- The fatigue your athlete experiences
- The gains your athlete achieves.
The previous articles looked at the context of training, monitoring the training your athlete does and the fatigue your athlete experiences. Now we’re moving on to look at how you can monitor the gains your athlete’s achieves.
Monitoring athlete gains
Fundamentally you need to be able to demonstrate to yourself and your athletes that the training they are doing is working. Gains can come in a variety of ways, so your monitoring should be equally widespread.
Getting fitter?
Getting your athletes fitter is a large part of what the training programme is intended to do. Can they transport and utilise more oxygen? And can they handle the by-products more effectively? However, to answer these questions and measure physiological markers such as VO2max or the aerobic and anaerobic thresholds that delineate the three basic training zones, you need access to a lab. An alternative would be to use performance data, such as 2k erg scores, and trust that if scores are improving, so is fitness. There is a possible middle way, which allows us to determine a physiological marker from performance results, and this is Critical Power.
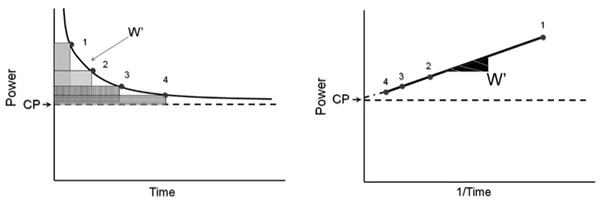
Critical Power is the power you could theoretically hold for a prolonged period of time, which is related to your aerobic fitness. To measure this you need to complete several efforts maximally over differing durations between 2 and 15 minutes – the broader the range the better. When graphing these efforts with power (in watts) on the y axis and 1/time (in seconds) on the x axis, the points should fall on a straight line. Where this line cuts the y axis is your Critical Power. The gradient of the line will indicate your W’ (pronounced W prime), which represents a finite amount of energy that you can call upon above your Critical Power, and reflects your anaerobic fitness. The formula of the line will come in the form of y = ax + b, where a is the W’ and b the Critical Power.
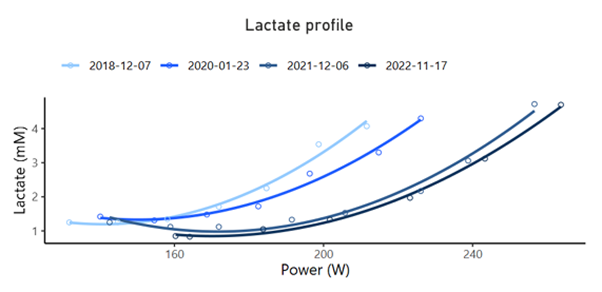
Other tests that monitor physiological aspects are the step test and ramp test. Both look at the relationship between internal and external load, the former generally via lactate, though you could use RPE or heart rate, and the latter through heart rate or ventilation. During a step test you would perform a series of pieces of a fixed duration, commonly 4 minutes, each at a higher sustained power than the previous one, with breaks to take lactate samples.
From the curve that is produced from graphing the steps you can determine the two thresholds between the three basic training zones. At a more basic level you want to see the curve tracking to the right over time, as is happening in this example, showing that you can sustain a higher power for the same lactate level.
Getting stronger?
You can track strength either through regular stand-alone tests, or by tracking training data.
The former, which could involve performing 3 or 6 rep max tests with weights or even on the Concept II Dyno, will give you clear data, but can take time as you taper, perform the various lifts and then recover from maximal efforts, as well as risking injury as you take your athletes to maximum under load.
The latter involves the practical difficulties of collecting, collating and analysing large amounts of data, as well as throwing up other issues. How, for instance, can you compare data across blocks when you programme different exercises for the same movement, or different variations of the same exercise? How can you compare data across different rep ranges?
One way of addressing the exercise issue is simply not to vary your key lifts. It might be that you think squats or deadlifts are absolutely critical, so you could always programme those, and have variation through other lifts around them. Bear in mind that you don’t need to track every single lift, just focus on your key ones. Alternatively you may be able to work out the proportion of the load of one lift you think athletes should be able to lift of another, and then use that value as a conversion factor. You can find these percentages online, or set the lifts for your athletes and see what number comes out. For instance, a front squat should probably be around 80% of the load you can back squat, while an overhead squat should be just over 50%.
To compare between rep ranges you can use the conversion coefficients given below, noting that there are different numbers for upper and lower body exercises. So, for instance, to see what your 6RM (rep maximum) squat might convert to as a 10RM squat you would multiply your 6RM by 1.242, then divide it by 1.41.
| Reps | Lower Body coefficient | Upper Body coefficient |
|---|---|---|
| 1 | 1 | 1 |
| 2 | 1.0475 | 1.035 |
| 3 | 1.103 | 1.08 |
| 4 | 1.1575 | 1.115 |
| 5 | 1.2 | 1.15 |
| 6 | 1.242 | 1.18 |
| 7 | 1.284 | 1.22 |
| 8 | 1.326 | 1.255 |
| 9 | 1.368 | 1.29 |
| 10 | 1.41 | 1.325 |
| 12 | 1.494 | 1.395 |
Other gains
Other areas of gym training can also be monitored for gains. Upper body muscular endurance can be tested by performing good quality press ups and supine rows to exhaustion. Trunk endurance can be tested by performing holds in supine, prone and lateral positions, either off a bench with legs supported, or through planks, side planks and raised leg holds. Flexibility can be measured quantitatively using a goniometer, a device to measure angles. You would need to determine which positions you deem important, such as thigh-to-chest and knee-to-wall to replicate the catch compression, straight leg raise to mimic the rock over off the finish, and seated rotation for sweep. Equally, you could look qualitatively at positions or movements, such as an overhead squat, which covers ankle, hip and thoracic flexibility, through the coach’s eye.
Erging faster?
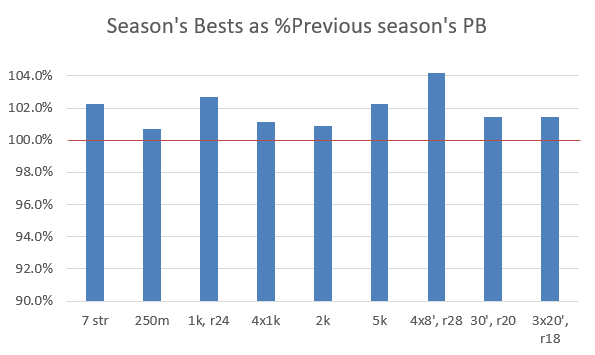
If you have a certain battery of erg tests that you use for monitoring, such as 7 stroke max, 250m, 2k and 5k, which you repeat regularly through the season, then comparisons can easily be made from a graph. Likewise you could check where athletes’ season’s bests are relative to their previous personal bests. The athlete below, for example, was having a good season on the erg.
Next we’ll look at how you can monitor athlete gains on the water.
Photo: James Andrews