This article is the third in a series by British Rowing Performance Satellite Coach Ben Reed on Monitoring and Assessment for Club Coaches. It’s based on a presentation he gave at the 2025 British Rowing Coaching Conference along with former British Rowing Satellite Coach (Yorkshire) Matt Paul.
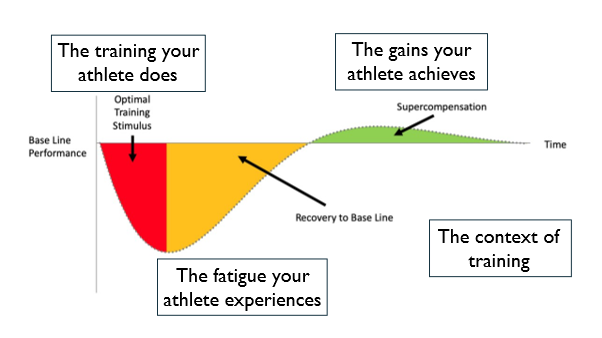
To recap on the first article in the series, monitoring can be split into four different areas, following the model of the training process itself:
- The context of the training
- The training your athlete does
- The fatigue your athlete experiences
- The gains your athlete achieves.
The previous articles looked at the context of training and monitoring the training your athlete does. Now we’re moving on to look at how you can monitor your athlete’s fatigue.
Methods of monitoring athlete fatigue
You can monitor how your athletes are handling the training load through subjective or objective methods.
Subjective methods
These revolve around asking your athletes how they are feeling across a range of elements. The most common are (with example questions):
- Mood: How does the thought of training make you feel?
- Sleep: How well/long did you sleep last night?
- Shape: What shape do you feel in?
- Stress: How stressed do you feel?
- Muscle soreness: How sore do you feel?
Answers could be given on a 1-5 scale, with 1 showing the athlete is struggling and 5 thriving. With a little bit of IT literacy you could produce a method for athletes to record this via their phones so the results are tabulated for you. Here’s an example (the athlete in question had a long-term injury, which explains why her yellow line was consistently low):
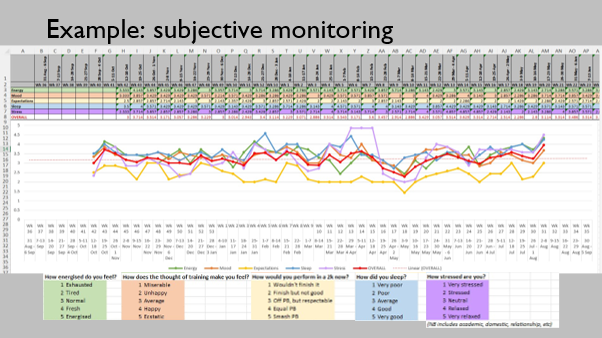
Note that the various elements track fairly well, but on occasion one will strike out on its own. This variation could be worth investigating, and justifies using a range of elements, not just one.
Likewise, research often seeks to justify subjective monitoring methods in terms of how well they track objective factors, such as changes in training load, or objective tracking methods I will talk about later. While you could argue that differences undermine the validity of subjective methods, I feel that instead they show the importance of this approach, as it might show something up that objective methods haven’t detected.
I should mention the related questionnaires that you can find online: for example, the Profile of Mood States (POMS), Daily Analyses of Life Demands of Athletes (DALDA), and Recovery Stress Questionnaire for Athletes (REST-Q). While too long for regular use, these could potentially be used at points through a season to give you a snapshot of how the whole squad is doing.
If this is too time-consuming for you, you could just get to know your athletes well individually and observe their demeanor at the start of training. One coach I knew tried to have an interaction of some sort with every athlete during a session to gauge how they were doing. Is the chatty athlete unusually quiet? Has the enthusiastic athlete turned up late for training, or not attacked the session with the usual gusto? Dr Stephen Seiler, one of the world’s foremost exercise physiologists, once told me that he uses the ‘Hair in the Yoghurt’ test. If, during a break, his athletes’ heads are drooping into their bowls, he knows it’s time to back off.
Objective methods
Many methods fall into this category. For example, unexpected changes in waking body weight are of interest, though you may not want your athletes becoming obsessed with their weight. There are lots of devices on the market that claim to monitor sleep quality or even recovery status. I have little personal experience of working with these devices, and perhaps at the moment the financial outlay may not justify the results you get, but they are there if athletes are interested. More common is using a heart rate monitor to track waking heart rate data, and athletes may already have one of these to track their training.
The simplest metric to track is resting heart rate (RHR). For this, athletes should, after peeing, record their heart rate while lying down over 5 minutes. A second step could be then to record how much their heart rate rises when they stand up. Ideally you would want resting heart rate to be tracking slowly down, and the gap between lying and standing to close. A plateau or gradual rise is a sign that the training might be too much. A sudden jump of 5-10 beats may suggest that an athlete shouldn’t do the day’s full training, if any at all.
A second metric is heart rate variability (HRV). Essentially, the time between heart beats won’t be exactly the same, and the variation in that time gives an indication of how rested an athlete is, higher variability showing better recovery. Free apps are available online to measure this (my squad used Elite HRV), linking to your heart rate monitor. Make sure you are tracking the rMSSD (Root Mean Square of Successive Differences) or its log, not a metric that the app has constructed itself. Also track relative changes for an individual, rather than comparing readings against a threshold or norm. Each athlete’s numbers will be unique to them.
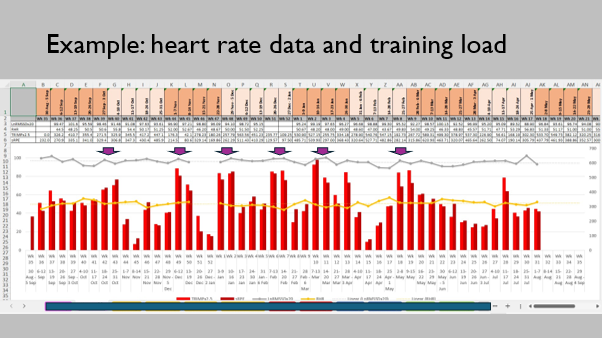
I use a combination of these two metrics, looking at HRV divided by RHR. Here is an example of a squad over a season. I have overlaid periods of high training load, and you can see that my metric tracked up during those periods.
Here is a season for one individual. I have marked four periods in the season when the heart rate data was of interest. In the first two instances, at the return to full-time training and following a back injury in February, the fluctuations were expected, but the return to baseline showed that things were back on track. When she became ill in April, the heart rate data warned us that this was coming. Lastly, the final period was the run into Henley Women’s Regatta, at which she performed well, which shows that at important events, sometimes the stress of the event can show worrying trends when actually performance is good.
Here is the same season for the individual, showing how the heart rate data tracked the training load. Peaks in training load (marked by the purple arrows) tallied with increases in HRV and drops in RHR.
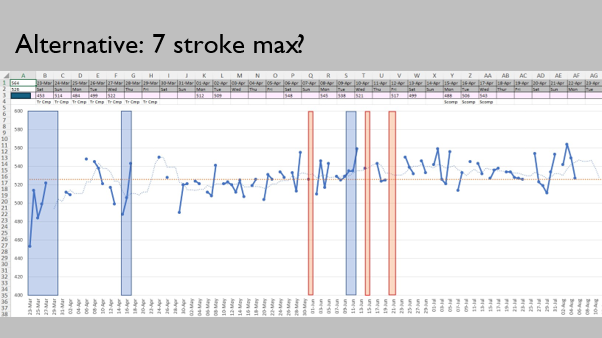
I did experiment to see if there were alternatives to heart rate data. Having read that the GB women’s hockey team used the countermovement jump (a vertical jump that involves a downward movement (countermovement) before an upward leap) to check on readiness to train, I wondered whether the 7 stroke max test on the erg could be used in a similar way. There does seem to be something there, with the data showing both short-term responses during heavy training loads, as well as a long-term upward trend over the season. The test was also relative easy to perform for the athletes.
For completeness, if not relevance currently, I should mention biomarkers; hormones, enzymes and proteins found in saliva, blood or urine that relate to the various systems of the body. Rugby, for example, looks at the ratio between cortisol and testosterone levels, but these methods are out of reach of most coaches.
Conclusion
Try to use a variety of methods to gauge how well your athletes are handling training. A mix of several subjective and objective methods may give you a wider view, one flagging something that the other has missed. For that reason alone it is probably unwise just to rely on one method, however ‘science-y’ it appears.
Track over the long-term, rather than just responding to short-term fluctuations. Perhaps see these methods as flags to prompt a conversation with an athlete, rather than leap in immediately and adapt the training.
In the next article in this series we’ll move on to looking at the final area of monitoring your athlete’s gains.
Photo: James Andrews