In his article Applying biomechanics: Analysis of the rowing stroke using force curves, Kieran Clark explained the force curves through the drive and the recovery phases, along with some guidance on how these should feel. He now takes this one stage further by looking at acceleration traces through the stroke.
Boat acceleration is the rate at which the rower-boat system speeds up and slows down, and we measure this in metres per second per second (m/s/s, m/s2 or ms-2). Before reading further, make sure you understand the difference between boat acceleration and actual boat speed, which is measured in metres per second (m/s or or ms-1).
Acceleration is a vital – but often overlooked – metric to track because it provides insight into the output (boat speed) that you gain for your input (force). You cannot have acceleration without force and you cannot have speed without acceleration.
Understanding acceleration traces
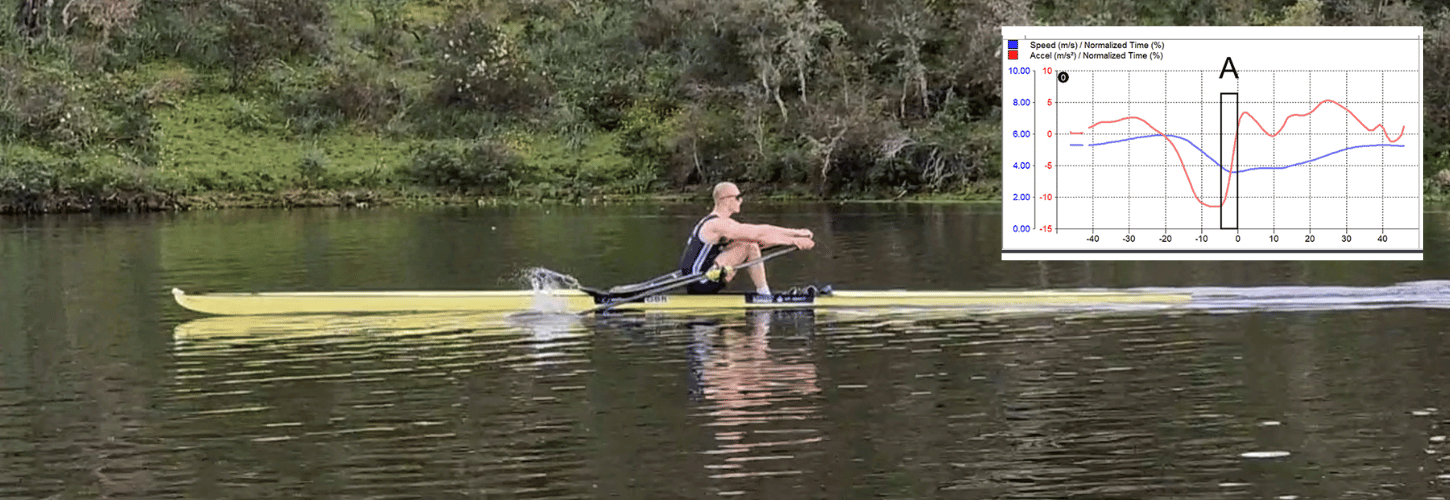
Acceleration traces start with the recovery on the left, as shown below.
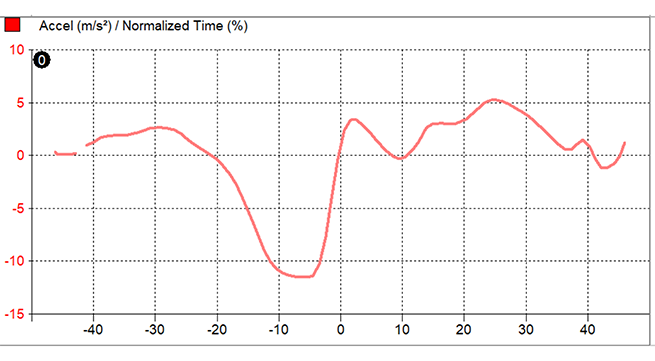
The dip in the middle is where the boat is slowing down towards the catch. This deceleration reduces to zero after the pickup, and then the boat starts to accelerate again.
Key points about acceleration traces
Point 1: Acceleration is at its steepest from the catch through the initial first half leg drive.
It is important to acknowledge that the rate of acceleration is steepest here because you are picking the boat up at its slowest point. The intent is not to reach maximum acceleration before the trunk opens – taking this approach would make it difficult to continue to add force and accelerate the boat into the second half of the drive phase.

Point 2: The faster the boat gets during the drive phase, the harder it is to continue acceleration.
The faster the boat gets during the drive phase, the more force and coordination is required to continue accelerating.
Point 3: The boat continues to accelerate through the transition as the trunk opens against the end of the leg drive.
Peak acceleration is reached as the trunk opens. However, peak boat speed is reached after this – between the release and quarter slide on the recovery, and closer to three quarter slide at race pace.
Point 4: At higher stroke rates and paces the recovery speed increases more proportionately than the drive, so while both happen faster, it’s the recovery where the biggest change in time takes place.
As Robin Williams explained in his article about the micro-moments of the rowing stroke, at paddling speeds (UT2 rate 20), the recovery lasts about 2 seconds, which is two thirds (67%) of the total stroke cycle. At race pace (firm, rate 36), this is nearly halved (0.96 seconds – 58% of a total stroke cycle of 1.66 seconds in a small boat). If you don’t manage that change well then that could have a significant impact on boat acceleration/deceleration.
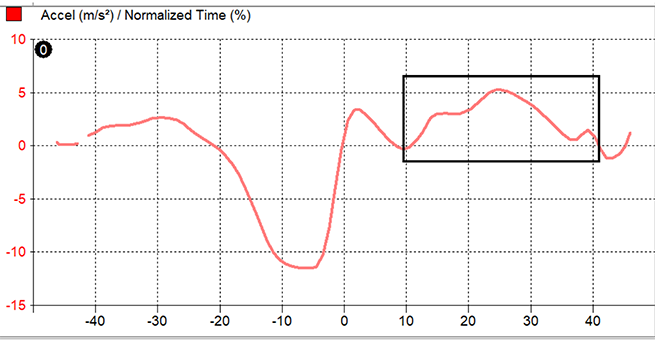
Point 5: During the recovery phase, the rate of acceleration will hover around 0ms-2.
The aim is to keep the acceleration trace above zero for as much of the phase as possible before the inevitable deceleration just before the pickup. At the elite level, crews that are going the fastest, particularly single scullers, are those who can keep their boat above the zero line for a high proportion of the entire stroke cycle, rather than just those who are producing the highest power.
Paying attention to the recovery phase of the acceleration trace can help you determine whether your recovery sequencing is slowing the boat down or maintaining speed.

Point 6: Deceleration is more pronounced at race pace than at paddling speed.
Conversely to point 1, this is inevitable because the acceleration will be higher as you take more powerful strokes at a higher stroke rate. A boat that is moving quickly will also decelerate quickly, due to the various resisting forces on the rower boat system.
What does ‘good’ look like in an acceleration trace?
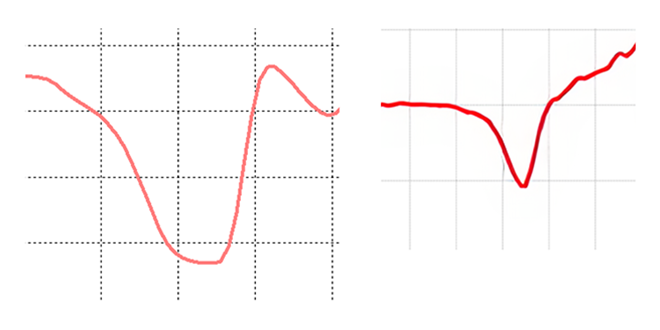
The boat has to slow down at some point and we want to ensure that it decelerates as smoothly as it accelerates. A smooth deceleration comes from a still and stable trunk position, loose arms and legs and with the weight equal through both feet.
Any extra movement at the end of the recovery phase (which will show up as a jagged line of deceleration before the pickup) will confuse the message you are giving the boat. Keep your movements into and out of the pickup as quiet and as simple as you can.
The relationship between force, acceleration and speed
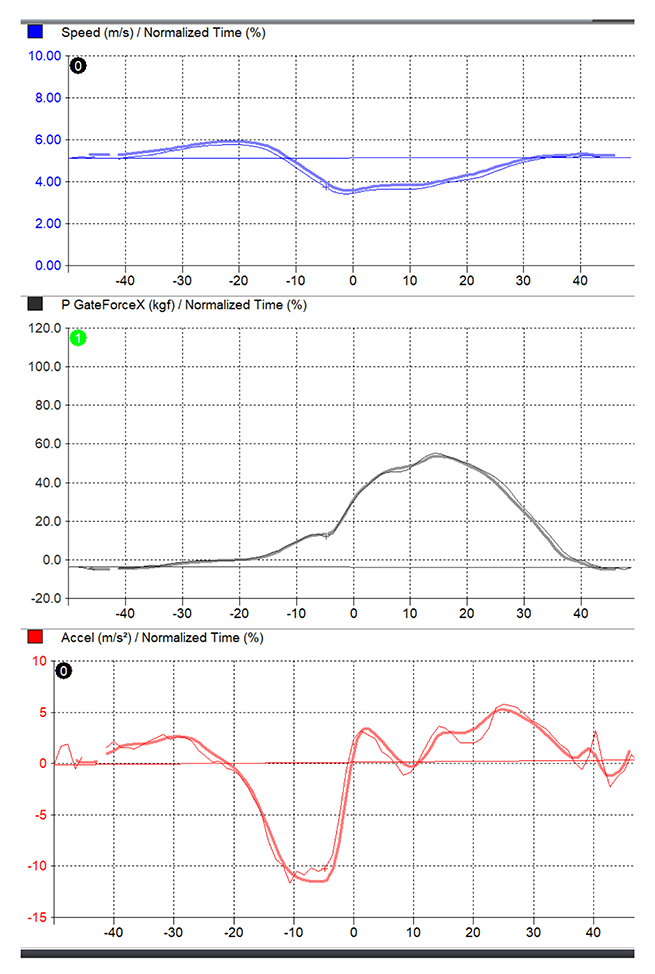
The two graphs below show gate force at the top and speed (blue) overlaid with acceleration (red) at the bottom over normalised time – the X axis displays 0 as the beginning of the drive and a percentage of time into and out of that point to account for the change in drive and recovery times at different intensities.
This gives a clear view of the relationship between the three, particularly that the peaks happen in order; peak force at around 15%, peak acceleration at around 25% and peak boat speed at around -20%. Assuming all things stay consistent, we can assume that higher peak force would result in a higher rate of acceleration, followed by higher boat speed. However, it is also important to note that the same amount of force can also result in a higher rate of acceleration through improvement of recovery sequencing and general control of an athlete’s body weight during the whole stroke cycle.
Acceleration (and deceleration) through the stroke
Here’s how the stroke looks at each section of an acceleration trace.
Conclusion
The relationship between power and acceleration is the key to creating boat speed. However, the two do not necessarily go hand in hand. Making changes to one can have a negative effect on the other as well as a positive one.
Most athletes and coaches will be familiar with force curves. A recent poll of 823 people1 showed that 89% of rowers could identify a force curve, but only 38% could identify an acceleration trace. As you can display a force curve on most rowing ergometers, this is perhaps not a surprise.
However, rowing races measure who goes fastest from A to B and not the amount of Watts produced in doing so. This means that acceleration traces, and particularly recovery sequencing, might be a good place to start looking for more speed.
This article is the fourth in Kieran Clark’s series on biomechanics and rigging in rowing.
1. Poll published on Instagram, January 2024.