Profiling involves building a wide-ranging picture of an athlete’s abilities, looking for strengths and weaknesses. Benchmarking is comparing either athletes or crews against standards to see if they are good enough. British Rowing Performance Satellite Coach Ben Reed explains how to do both.
Erg profiles
Some national teams use or have used a battery of erg tests to determine their athletes’ erg power profiles, as detailed below:
| Canada | Denmark | GB | Australia |
| Peak power | 10 seconds | ||
| 1 minute | 1 minute, r36-46 | 250m, r42-44 | 500m, free |
| 2k | 2k, r30-34 | 2k | 2k |
| 6k | 6k, r26-28 | 30’, r20 | 5k and/or 30’, free |
| 18k, r18 |
Two have calculated detailed relationships between the various tests relative to the 2k score (for power, not splits):
| Denmark | GB |
| 10 seconds: 173% | |
| 1 minute, r36-46: 153% | 250m, r42-44: 140%+ |
| 2k, r30-34: 100% | 2k: 100% |
| 6k, r26-28: 76% | 30’, r20: 65-75% |
| 18k, r18: 55-60% |
I have done something similar over many years at various clubs, using a consistent battery of erg tests, and trying to establish whether there is any sort of relationship (here as % of splits) between them. Given the shape of the power-duration curve, the tests that are 1k or longer are more consistent, as demonstrated by the lower standard deviations shown in the white rows.
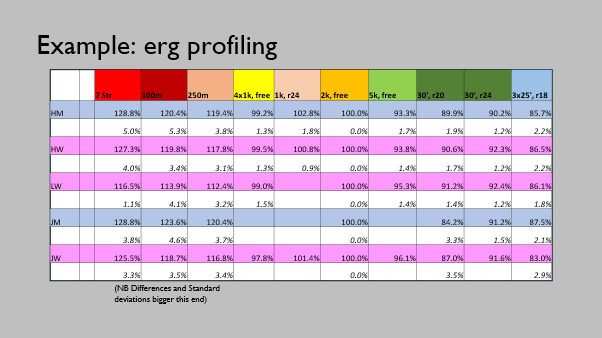
The erg power profile can be used in different ways. First, from one or two erg results, you can predict targets for the rower in all the other ergs in the battery. Second, from an athlete’s power profile plotted against a model of the predicted values based on their 2k score, as shown below, you can determine strengths and weaknesses, and plan their training accordingly.
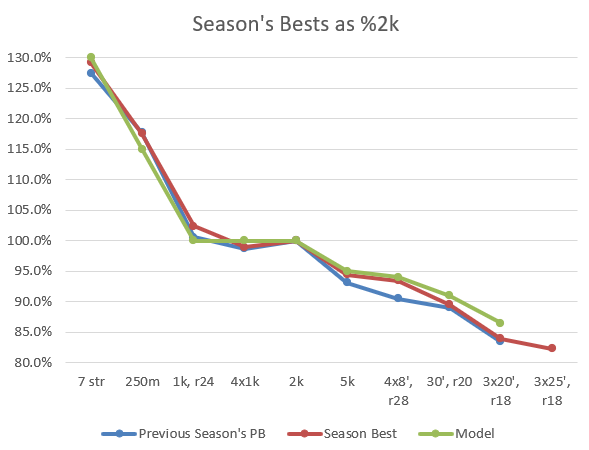
From this example, this athlete is typically above the model on shorter distance ergs, but below it on longer ones. This may just reflect their genetic make-up, but it would be worth focusing their effort on seeing if aerobic gains could be made, by increasing the volume of their low intensity training, even if at the expense of an interval or weights session if training time is limited.
Strength profiles
You can do something similar with lifts in the weights room. It might be that, for example, an athlete should be able to lift a certain percentage of their back squat when performing front squats or deadlifts. Here is an example I developed for women, based on training data as well as targets. Again this is something you could do for your group of athletes to get data that is relevant to you. I wouldn’t be too prescriptive as there is a large degree of variation between athletes, but it might highlight an issue if an athlete is a long way off the model in a particular lift.
| As % of Back Squat | Romanian Deadlift | 100% |
| As % of Back Squat | Deadlift | 110-115% |
| As % of Back Squat | Front Squat | 75-80% |
| As % of Back Squat | Power Clean | 80% |
| As % of Back Squat | Bench Pull | 75% |
| As % of Bench Pull | Bench Press | 90% |
On-water benchmarking
Most national teams will have prognostic Gold Medal Times (GMTs), that if a crew can beat they are guaranteed to win the gold medal at the next Olympics. Given the guaranteed nature of these times, they assume perfect conditions (hot water, strong tail wind, tapered crews, etc.) and are faster than the World Best Times (WBTs). By converting these to splits, you can compare times from any on-water time trial to GMT. By expressing times as a percentage of GMT you can compare between boat classes, with each crew measured against their own GMT. As an example, these are the GMTs the GB Rowing Team used when I was involved with it in the 2010s:
| Boat class | Men | Women | Lightweight Men | Lightweight Women |
| 1x | 6:30.0 | 7:05.0 | 6:38.0 | 7:17.0 |
| 2x | 5:57.0 | 6:34.0 | 6:04.0 | 6:42.0 |
| 4x | 5:30.0 | 6:05.0 | 5:38.0 | 6:13.0 |
| 2- | 6:08.0 | 6:47.0 | 6:19.0 | |
| 4+ | 5:54.0 | |||
| 4- | 5:36.0 | 6:12.0 | 5:42.0 | |
| 8+ | 5:17.0 | 5:50.0 |
As there is an element of prediction in GMTs, you might prefer to use actual World Best Times instead, which are not that different. You can find these on the World Rowing website. Currently they are:
| Boat class | Men | Women | Lightweight Men | Lightweight Women |
| 1x | 6:30.74 | 7:07.71^ | 6:39.56* | 7:23.36* |
| 2x | 5:59.72 | 6:37.31 | 6:05.33 | 6:40.47 |
| 4x | 5:32.03 | 6:05.13 | 5:42.75* | 6:15.95* |
| 2- | 6:08.50 | 6:47.41 | 6:22.91* | 7:17.02* |
| 2+ | 6:33.26*~ | |||
| 4+ | 5:58.96** | 6:43.86** | ||
| 4- | 5:37.86 | 6:14.36 | 5:43.16* | 6:36.40** |
| 8 | 5:18.68 | 5:52.99 | 5:30.24** |
*Non-Olympic event; **Non-Olympic event with WBT pre-2012; ^WBT from 2002; ~Both 2+ and 2- were the Kiwi Pair
There are still issues with these numbers. The obvious distinction is that between those boat types that compete in the Olympics, and those that don’t. The WBTs for Olympic class boats should have been set by better athletes, and more recently – mostly since 2012. Some have also benefitted from especially fast conditions; there are a disproportionate number of WBTs from the 2020 Tokyo Olympics and the 2014 World Championships. Two other anomalies stand out: Rumyana Neykova’s W1x time still stands from 2002, while the M2+ time was set by the Kiwi Pair, even though a non-Olympic event.
Despite this, the idea of threshold times does have practical value. If you are uncomfortable comparing your crews against elite times, you can research times for the competitions that you target. The major regattas – such as Henley Royal and Henley Women’s Regattas, National Schools and the various British Rowing Championships – publish their records online. From these you can determine a time you need to be capable of in order to win an event, be on the podium, or make the A final. This can give you something to aim at in training, or a threshold that crews have to attain before being entered.
From your race targets you can produce sub-maximal benchmarks. For instance, Rowing Australia reckons that you should be able to paddle for a prolonged distance at 80% of your target 2k time at rate 18-20, and row at 90% at rate 28.
The use of telemetry in boats opens up the possibility of setting power targets, either individually or as a crew average, to achieve given boat speeds. NK have published observed values for rowers of different abilities recorded using the Empower oarlock. If you keep records for a season or two, you should start to discern trends.
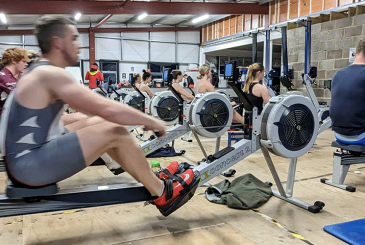
Erg benchmarking
Just as you have on-water WBTs, Concept II publish both world and British records for all age groups. Expressing erg scores as percentages of these would allow you to compare between athletes should you have a very mixed squad in terms of sex, age and weight category.
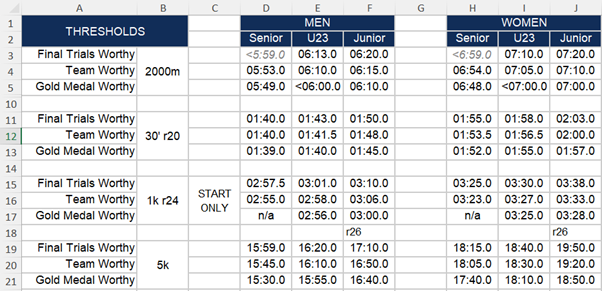
Equally, even though the link between water speed and erg score is contentious, you can set erg standards for your squad. The GB Rowing Team has erg cut-offs for its trials process. Likewise, as an exercise during lockdown, the Start coaches produced a table of erg standards, shown below. Similarly, you may feel that you are able to set erg targets for crews if they are serious about winning at certain competitions.
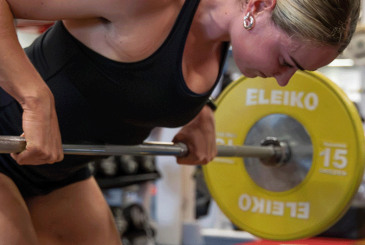
Strength benchmarking
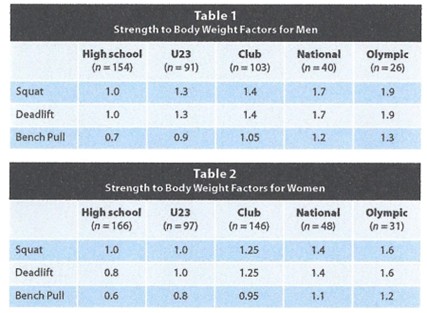
A common question coaches ask is ‘How strong does an athlete need to be?’ National teams have such thresholds, expressed either as absolute load, or percentage of body mass. Unfortunately the information available to club coaches comes from a Canadian S&C coach, Ed McNeely, who has written an article, available online, entitled ‘Strength and Power Goals for Competitive Rowers’, as well as a chapter in Rowing Faster edited by Volker Nolte. His targets are shown below.
<Insert diagram here>
These numbers, however, do not tally with my experience, and even Olympic gold medal winning athletes have won their medals without attaining them.
Again after a few seasons of record keeping, it should be possible for you to get an idea of where you would expect your athletes to get to, and perhaps even link values in the gym with results on the water at key competitions.
Other areas of gym work, and the holds and positions to monitor core and flexibility as outlined in the article on Monitoring athlete gains on land, can have standards put to them that you would like your athletes to aim for, and ideally achieve.
This article is one of a series by British Rowing Performance Satellite Coach Ben Reed on Monitoring and Assessment for Club Coaches. It’s based on a presentation he gave at the 2025 British Rowing Coaching Conference along with former British Rowing Satellite Coach (Yorkshire) Matt Paul.
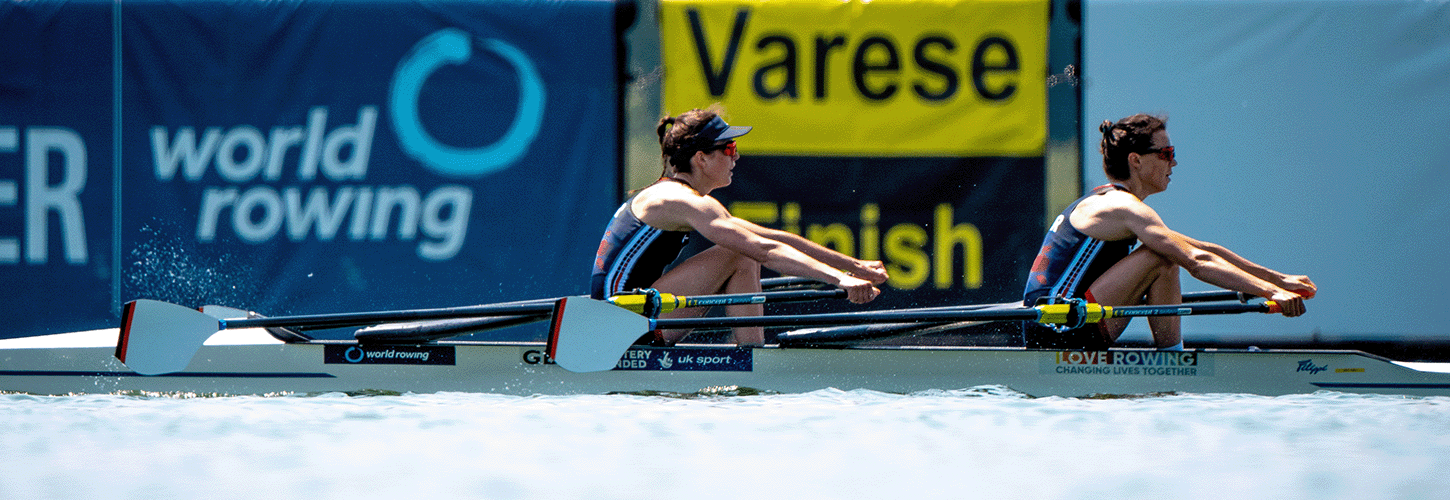
Banner photo: Benedict Tufnell (of GB’s Emily Craig and Imogen Grant setting the current World Best Time for LW2x at World Cup II in 2023).