This is the fifth article in a series by British Rowing Performance Satellite Coach Ben Reed on Monitoring and Assessment for Club Coaches. It’s based on a presentation he gave at the 2025 British Rowing Coaching Conference along with former British Rowing Satellite Coach (Yorkshire) Matt Paul.
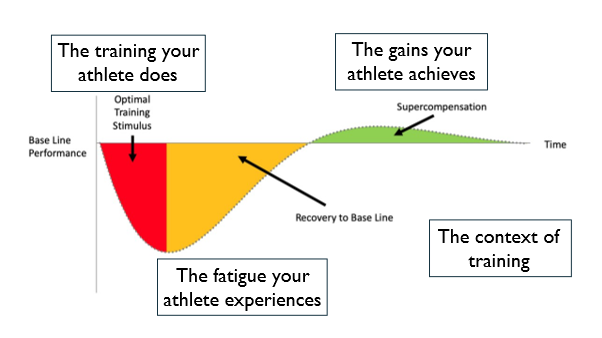
To recap on the first article in the series, monitoring can be split into four different areas, following the model of the training process itself:
- The context of the training
- The training your athlete does
- The fatigue your athlete experiences
- The gains your athlete achieves.
The previous articles looked at the context of training, monitoring the training your athlete does, the fatigue your athlete experiences, and monitor the gains your athlete’s achieves on land. Now we’re looking at the final element; monitoring athlete gains on the water, which is ultimately the one that really matters for winning rowing races.
Rowing better?
It goes without saying that in order to monitor athletes’ technical development, you must be working to a clear technical model, and ideally one that incorporates what is known to move boats quickly.
British Rowing has videos and photos to help you develop one. For the more scientifically-minded, two books – The Biomechanics of Rowing by Valery Kleshnev and Rowing Science edited by Volker Nolte – are essential reading. Lastly, watching videos of top level international racing will give you an indication of what elite crews are doing. World Rowing and the Olympic Games both have their own channels on YouTube.
At its most basic, you can use your coach’s eye to detect technical improvements in your athletes, which can be fed back to the rowers during the outing.
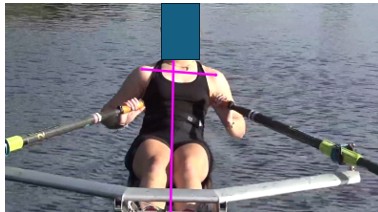
A step-up from that would be video analysis, perhaps using the analytical software mentioned above. This allows you to work through footage frame by frame, as well as draw lines on the images to help you, as shown below. The downside of this is that it has to happen off the water. It is, however, a good idea to calibrate your coach’s eye against video footage from time to time, to make sure that what you are telling the athletes on the water is actually the case. A step-up from that would be video analysis, perhaps using software such as Dartfish or Kinovea, which I prefer.
Telemetry has its uses here, but one weakness is that while it tells us a lot about what is happening to the equipment – the boat, pins and blades – it does not tell us how the rower is moving to achieve this. You would need to tally the telemetry read-outs with video footage of the session to work out what element of the rower’s technique is causing the issue you are seeking to address. Equally, you need to have enough experience to know how to ‘read’ the telemetry output to get the most out of it.
There are simple and cheaper alternatives to what telemetry can show us, such as:
- Using video footage from bridges or drones or straws taped to the sides of the hull to check arc angles
- Looking for movement of the boat within the video frame, or the spout of water emerging from a straw taped to the stern of the boat, to get an impression on the amount of acceleration or check.
Example technique assessment approaches
Here are three examples of methods I have used to assess technique, which, if repeated through the season, allow for monitoring of improvement.
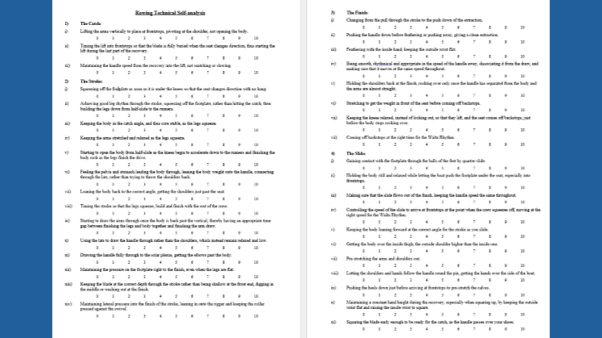
Rating technical aspects
The first can be used in real-time or with video footage and rates various aspects of technique. You don’t need to go into such detail; indeed it might be better if you don’t, but rather focus on the really important elements or just one section of the whole stroke.
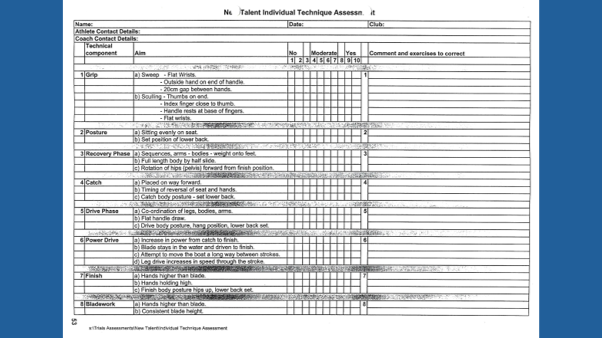
A simpler version of the same idea can be seen here, this time from GB’s New Talent programme run in the early 2000s.
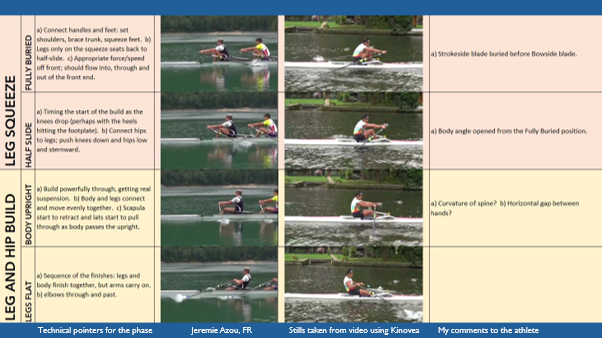
Comparison with a good model
The second example looks at positions through the stroke, comparing those of the athlete to a good model, in this case the French Olympic champion, Jeremie Azou.
Gantt chart-based movement analysis
Finally, using a Gantt chart as a model, you can look at the sequence of movements through the stroke.
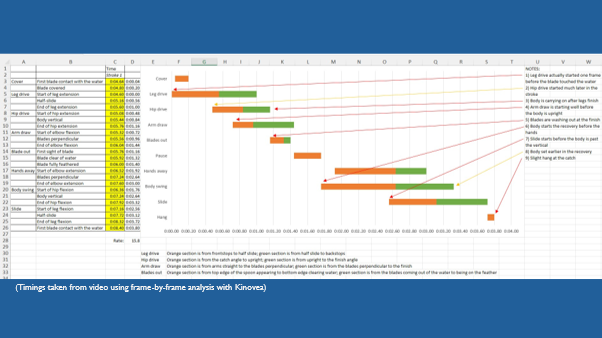
These last two examples work off an analysis of just one stroke, so it is important that your athlete is good enough to be highly consistent, and that you choose a representative stroke to analyse.
Rowing faster?
Boat speed can be measured via a Speedcoach, perhaps using an impellor to reduce the effects of stream. Alternatively, you can time crews over a set distance. Again, the effects of stream can be reduced by doing pieces upstream and downstream, and working out still water time using the formula: (2 x upstream x downstream)/(upstream + downstream).
By running time trials regularly over the same course you can compare across the season to detect speed improvements. Bear in mind that water temperature is critical to boat speed, more so than generally realised, so you may find that times do not improve into the winter months. There is little that can be done to correct for this, other than simply remembering that it will make winter times look stagnant before a surge in the spring.
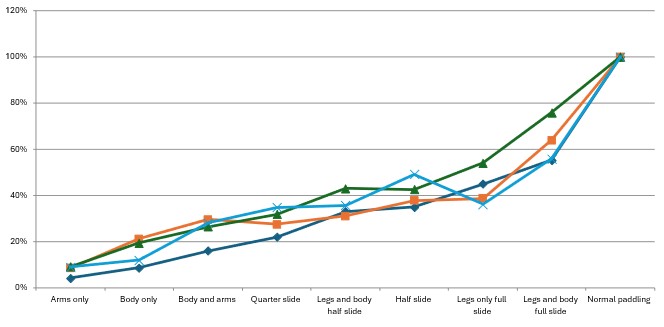
Thinking outside the box a little, you can look at other areas of boat speed to help with development. For example, as shown below, I had a quad run through a pick drill and, using telemetry, looked at the work that each rower produced at each step. While the overall pattern is similar, there are elements which were worth digging into to see if we could improve overall boat velocity. For instance, why does the orange rower drop relative to the rest of the crew moving from body and arms to quarter slide? Why does the light blue rower drop between half slide and legs only full slide?
A session I really like is 10 x 500m, step rates, which looks at how boat speed increases with increasing rate. Perform the 10 reps as pairs, upstream and downstream, and calculate a still water time for each rate, as described above. Then plot these against a model curve. To generate the model velocities for the various rates, based on the velocity recorded for your lowest rate, use the following formula: model velocity = recorded velocity x (model rate/recorded rate)1/3.
From the graph produced, you can see whether your crew is able to take its speed up the rates or, if not, at what rate it de-couples. Both the single scullers in the example below fall away from the model lines at rate 26, so that would be a good rate to work on.
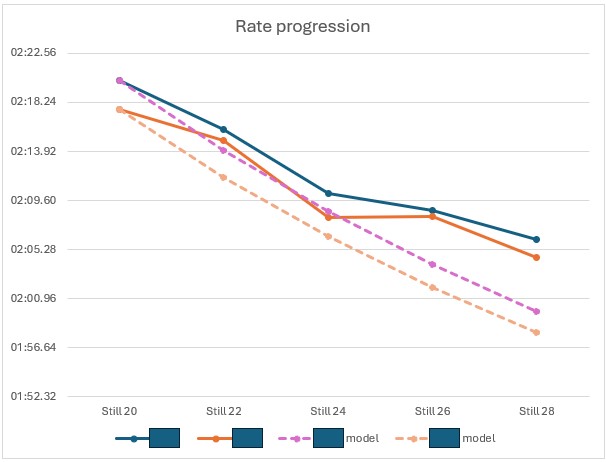
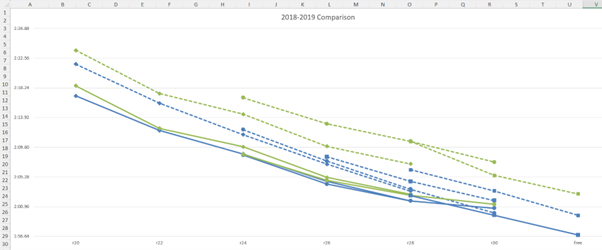
The graph below shows a combination of several of these sessions completed on training camps in 2018 (dotted lines) and 2019 (solid lines) by two athletes (blue and green lines). You can see the improvement they show, both in going faster for each rate, and showing much greater consistency, the lines from the different sessions overlapping in 2019 having been spread out in 2018.
In the next article in this series, we’ll look at athlete profiling and benchmarking.