The previous articles in this series have looked at the role of biomechanics in rowing and how to understand the key principles and adjustments in rigging. Now, Kieran Clark turns the ‘why’ into ‘how’ and explains force curves through the drive and the recovery phases, along with some guidance on how these should feel.
Understanding force curves
The force curves in this article are produced by the telemetry system fitted to the boat. In the example analysis screen below you can see data about the piece on the left (rating, average boat speed, distance per stroke, average power and rower swivel power) and the force curve on the right.
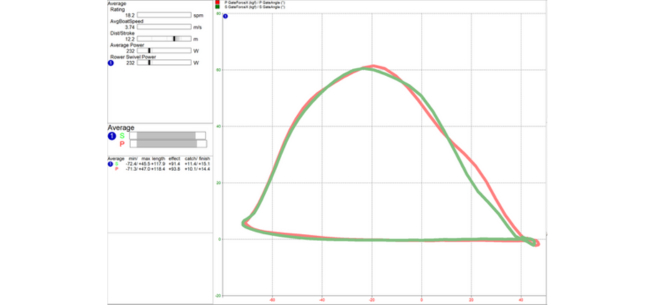
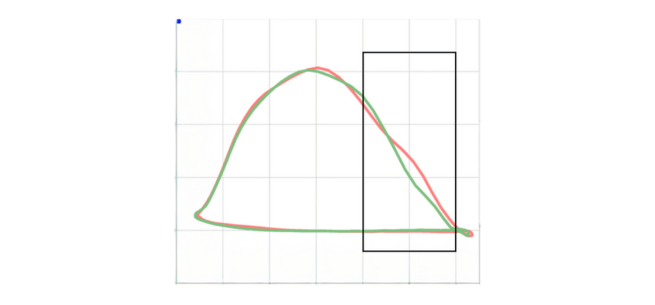
The force curve shows the average force through the stroke cycle throughout the piece that was recorded. The red and green lines show the different forces applied to the port (strokeside) and starboard (bowside) pins/swivels.
The force curve below is annotated to show the parts of the stroke cycle.
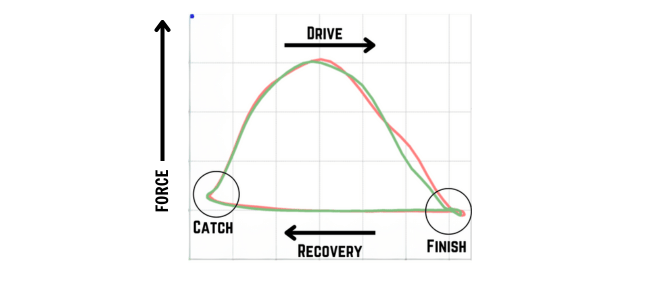
How: Drive phase
Part 1: Pickup
The spoons are placed into the water a fraction of a second before the legs/feet change direction. Aim to have the trunk still and stable and pressure on the footplate as the spoons enter the water – this creates the connection to the water and begins the force production.
Part 2: First half of the leg drive
With the arms relaxed, the trunk maintains its position and angle as force is applied to the foot stretcher and the legs begin to accelerate the boat. The legs are pushed from full compression with shins vertical through to a 90 degree knee angle (halfway down).
Part 3: Transition
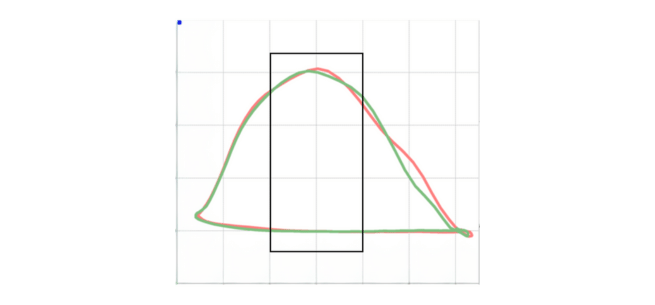
Once the knee angle passes 90 degrees, the trunk opens against the end of the leg drive. This creates the peak at the top of the force curve (also known as peak force). The back of the knees press down onto the deck of the boat, with the quads and then the glutes engaging to maintain a tall and strong finish posture.
Part 4: Finish
The force is maintained on the foot stretcher and the legs continue to drive through to create tension through the whole body, connecting the handles to the footplate. Once no further connection is possible, release the blades or oar in front of the body.
How: Recovery phase
Part 1: Release
This is the bottom right corner of the force curve. The hands are moved calmly and continuously, maintaining the handle speed from the end of the drive phase to remove the spoons cleanly from the water. Think about this being a quiet, easy movement to avoid putting negative force onto the gate.
Part 2: Separation – Hands, body, slide!
The first half of the recovery is about moving yourself. Organise the sequence of your body parts to start to set up a strong and tall catch position.
Aim to have your hands leading the recovery, followed by your trunk rocking forward at the speed of the hands with the weight shifting onto the footplate.
Part 3: Run
The second half of the recovery is about keeping the boat moving. If your sequencing is good and your weight is set, you can focus on maintaining speed on the boat for as long as possible before it decelerates just before the pick up.
Performance points to look out for
The main thing you’re looking for is maximum area under the curve. Greater area indicates greater force production over the whole drive phase. This can (but not necessarily will) result in higher boat speed.
If you see any of the following, there’s technical work to be done:
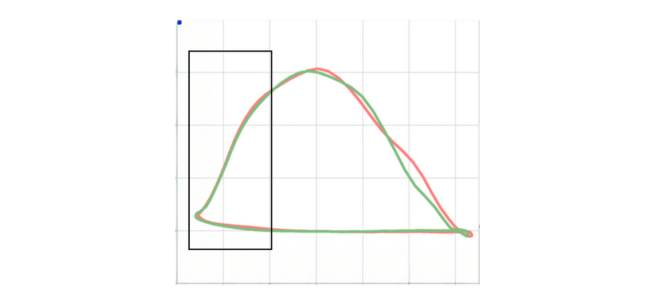
- Tails at either end of the force curve – where the handle is moving with minimal force. This shows a lack of effective length. You can read more about this in the first article in this series on The role of biomechanics in efficient rowing.
- Dips in the curve or changes from a smooth curve. This is more common at the finish than during the leg drive or transition. Once force production has begun at the pickup, a smooth and consistent application of power is going to give you a better return of boat acceleration than ‘kicking’ the boat too hard with the legs and then failing to add power with the trunk and arms. Creating a smooth curve at the finish requires a high level of skill and coordination, as well as trunk strength, to maintain force. Even in the example curve used from an elite rower, you can see that the shape is neither symmetric nor consistent across both sides in the sculling boat.
Top telemetry tip
When using telemetry to measure and improve your efficiency, aim for gradual improvements and focus on one thing at a time.
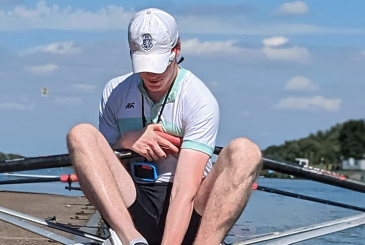
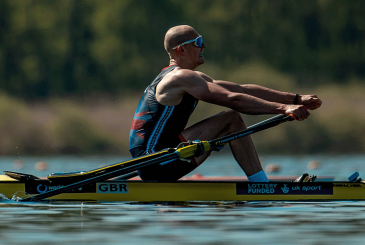
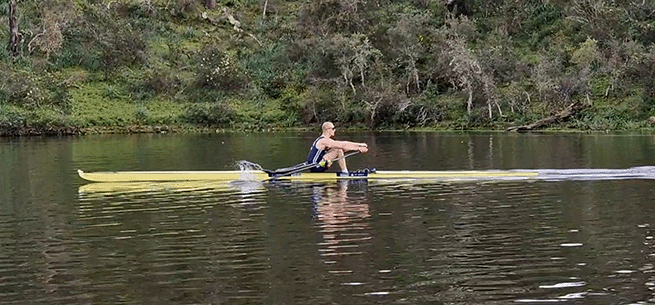
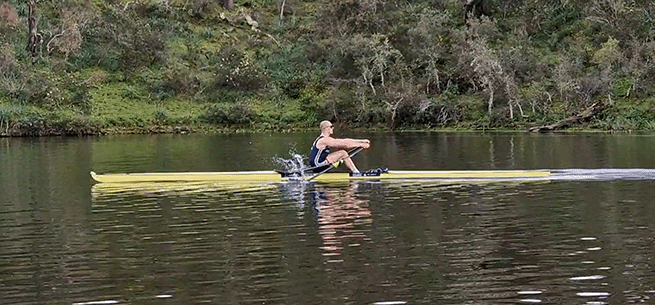
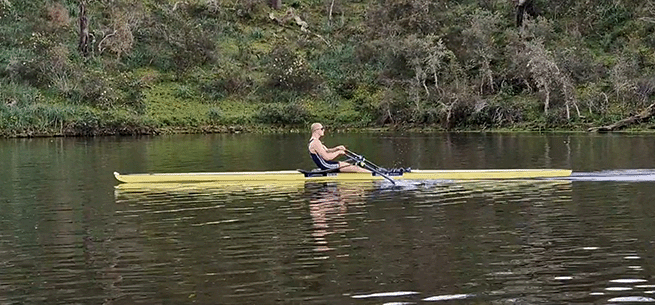
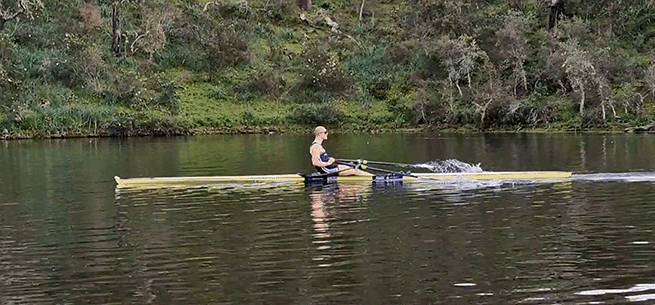
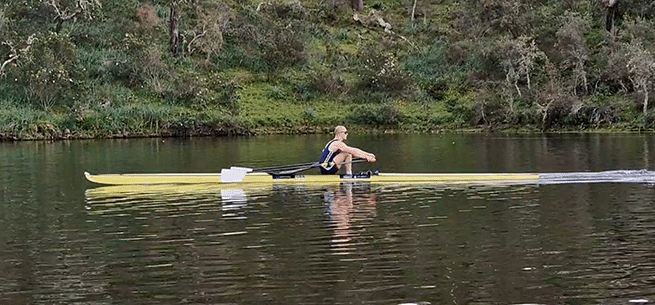
Photos: Kieran Clark. With thanks to GB Rowing Team athlete George Bourne.